by Tom McClintock
Research Associate, Getty Conservation Institute
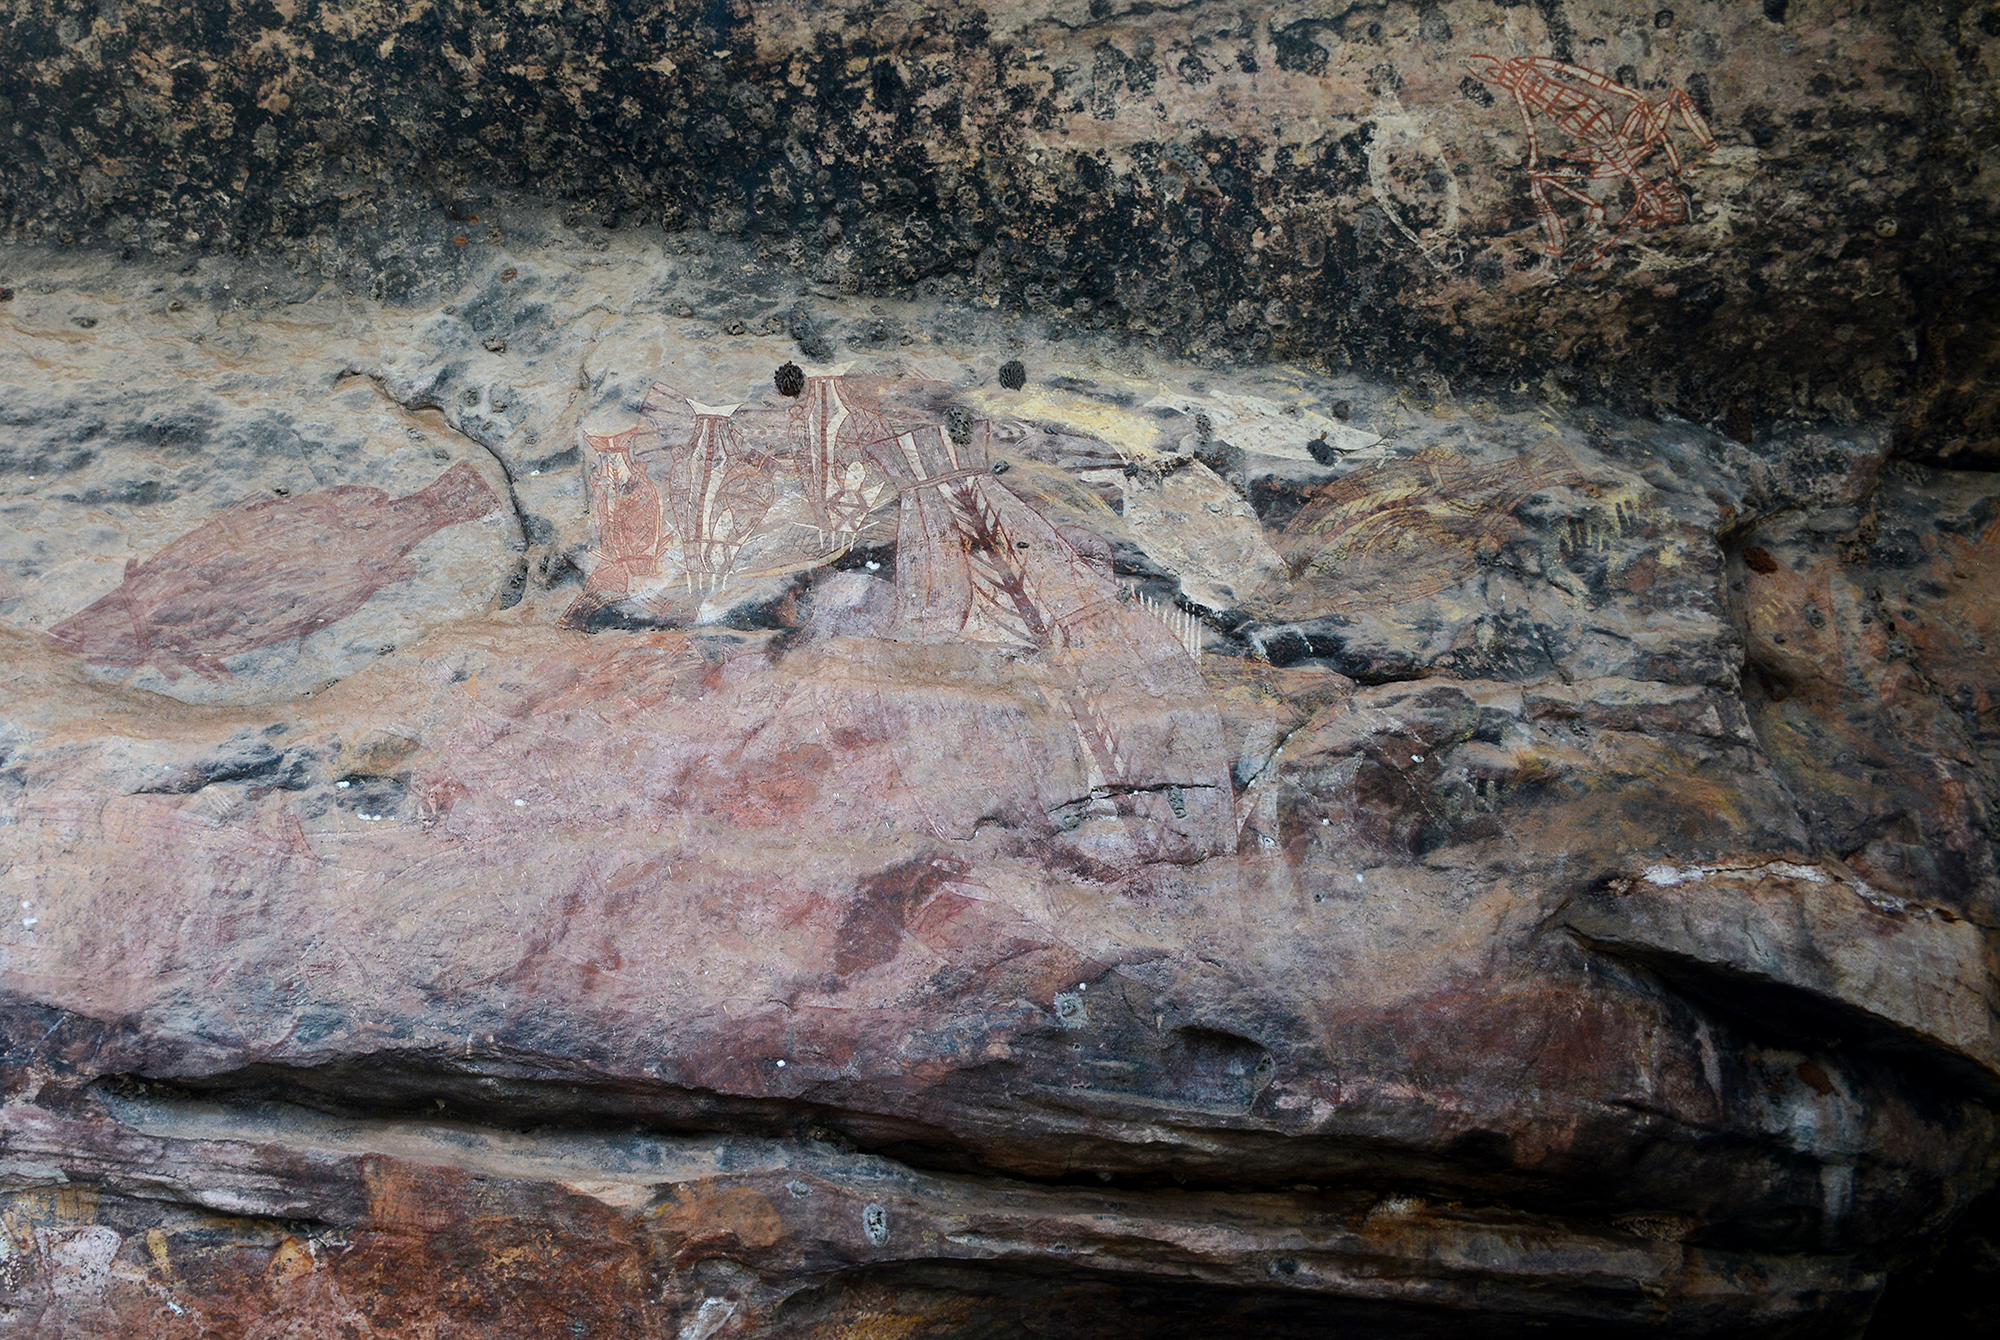
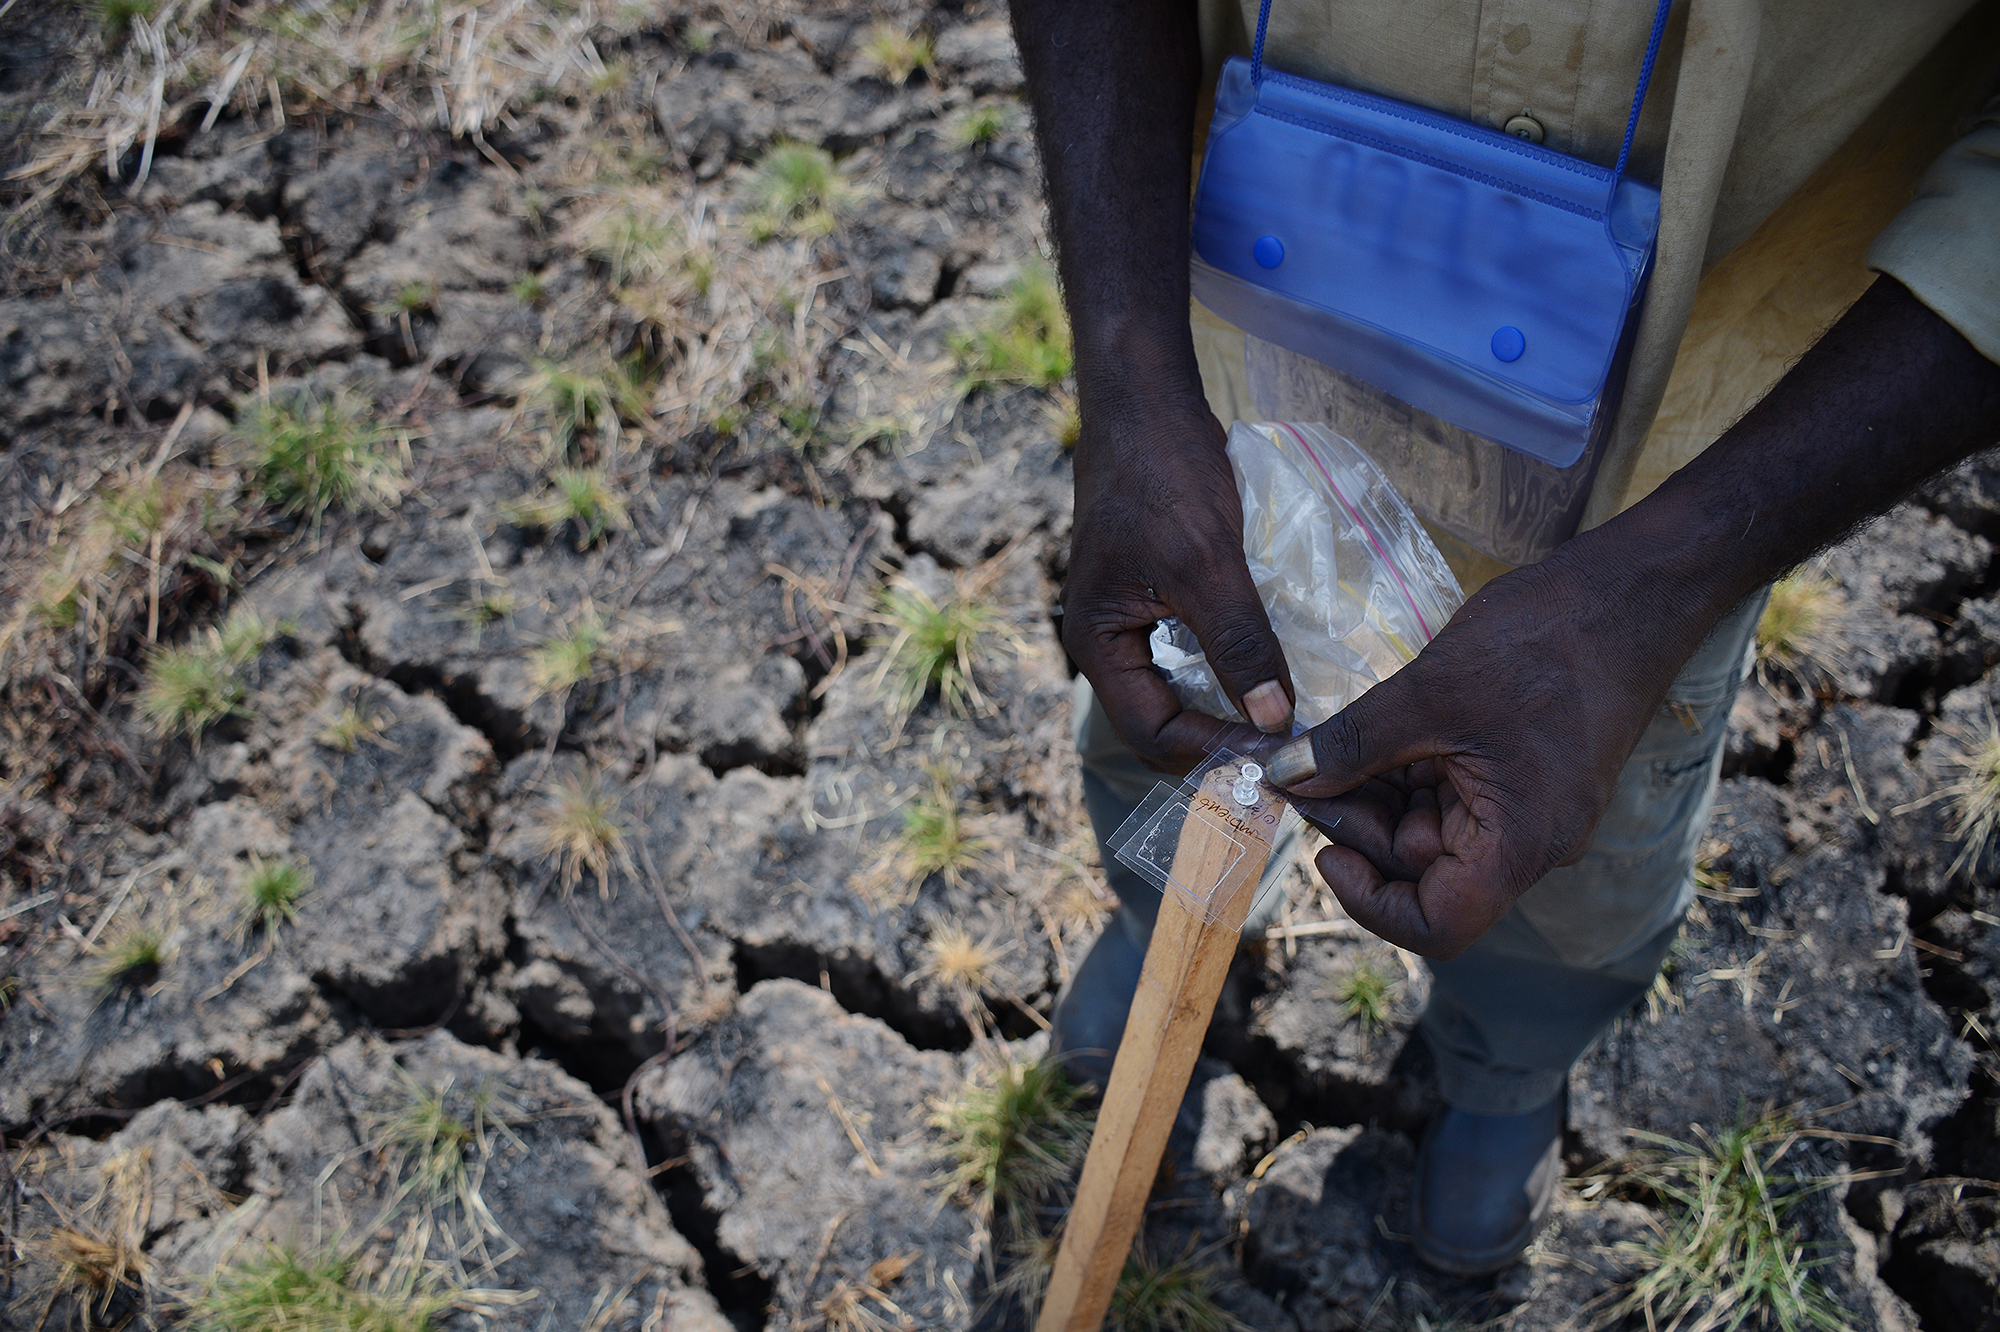
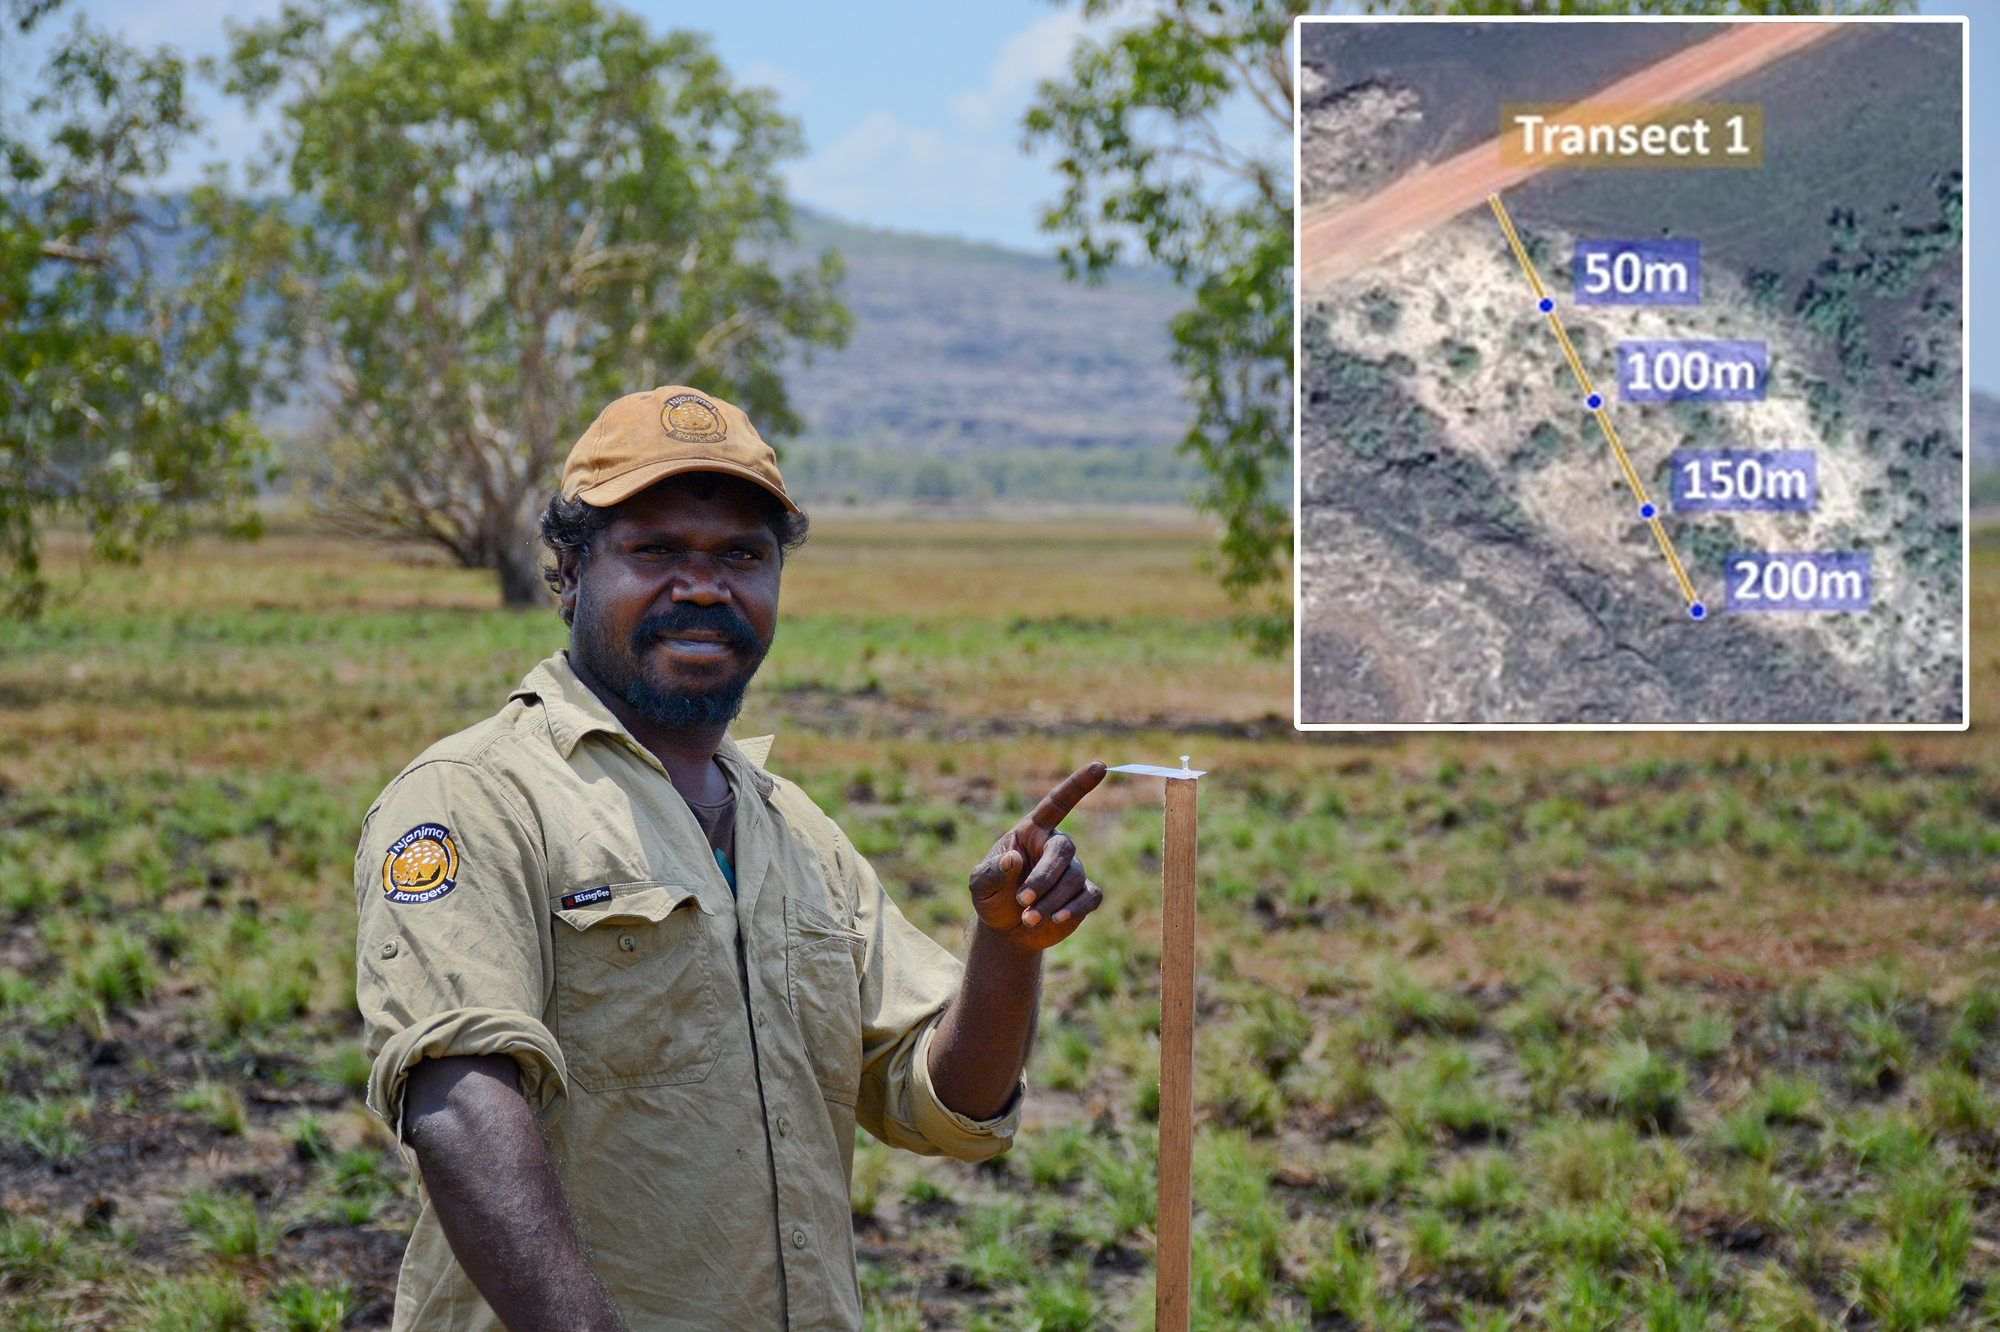
To measure distance dust could travel, Mylar swatches of 4cm2 with tape on one side were mounted to garden stakes stuck in the ground every 50 meters in a perpendicular line from the road (Fig. 4a & Fig. 4b). Similar swatches were placed at select sites with rock images. An additional four sampling stations were placed in a flood plain approximately 500 meters to the northwest of the road, away from off-road driving tracks, to measure ambient airborne dust conditions.
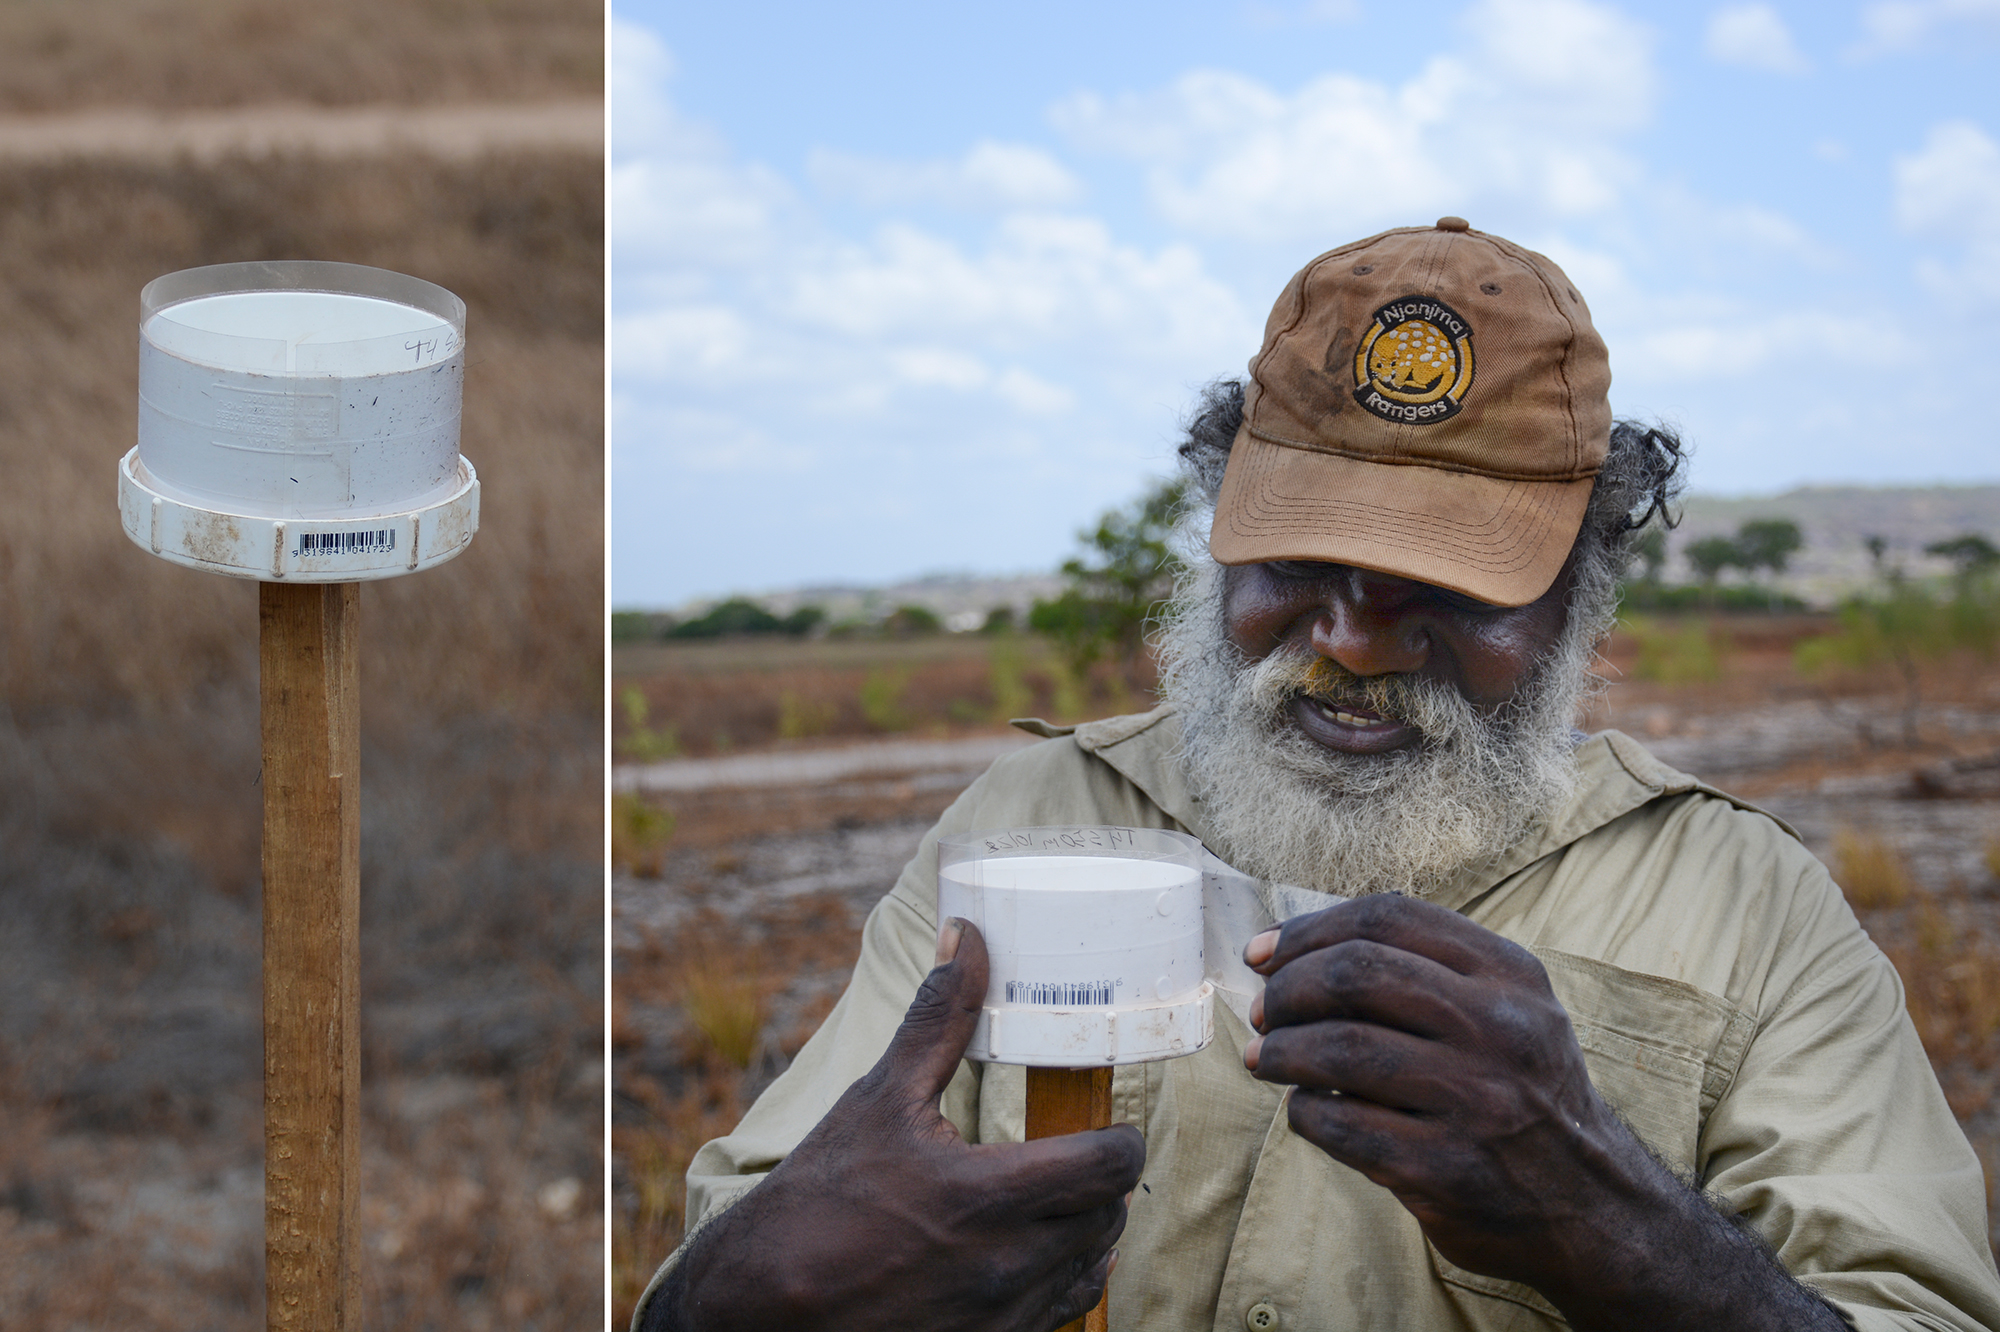
For directional sampling, 10cm diameter PVC pipe with threads on one end was cut into 6cm lengths (Fig. 5). A PVC end cap was screwed to the top of a garden stake so the pipe could be mounted atop. 12cm x 30cm sheets of Mylar were covered evenly on one side with double-sided tape, which were then wrapped around the PVC pipe. These Mylar sheaths, once mounted, were marked for magnetic north.
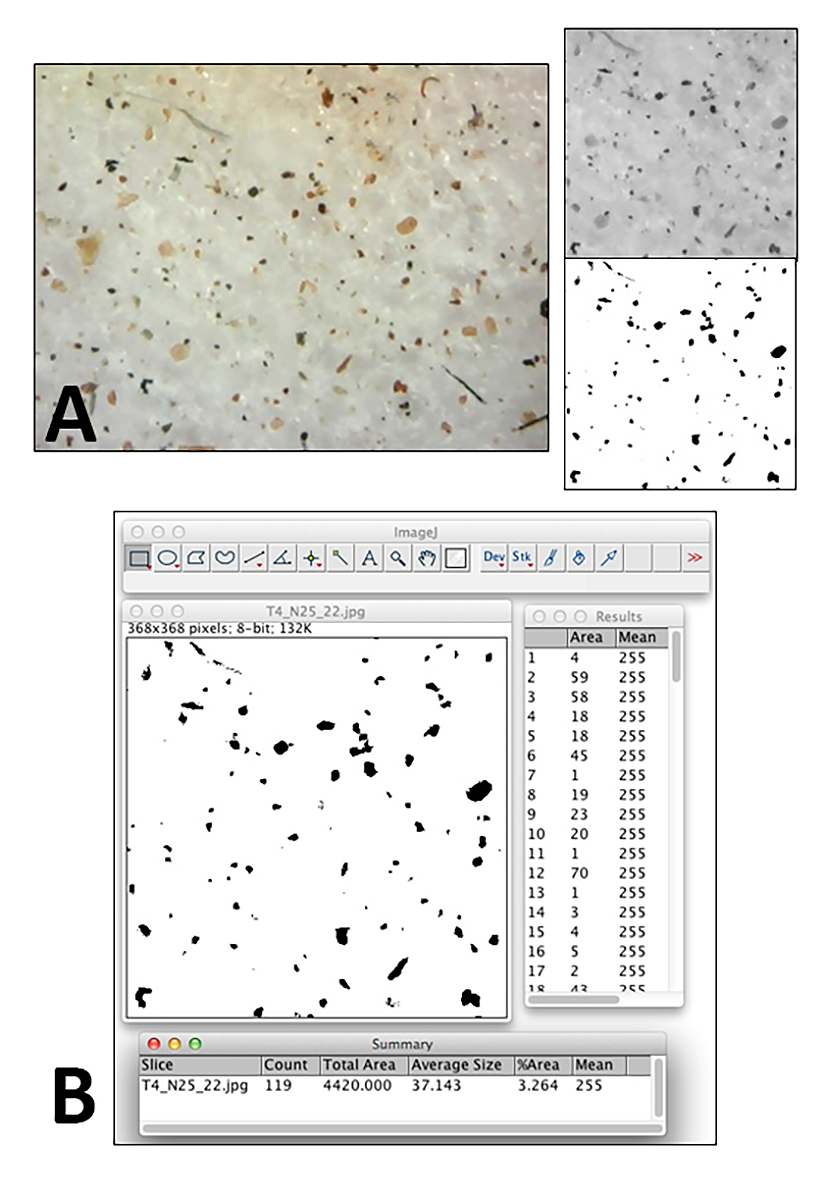
Both sampling methods were deployed for 1-week collection periods. When ready for collection, the exposed double-sided tape of each sample was covered with clean Mylar and labeled with permanent marker.

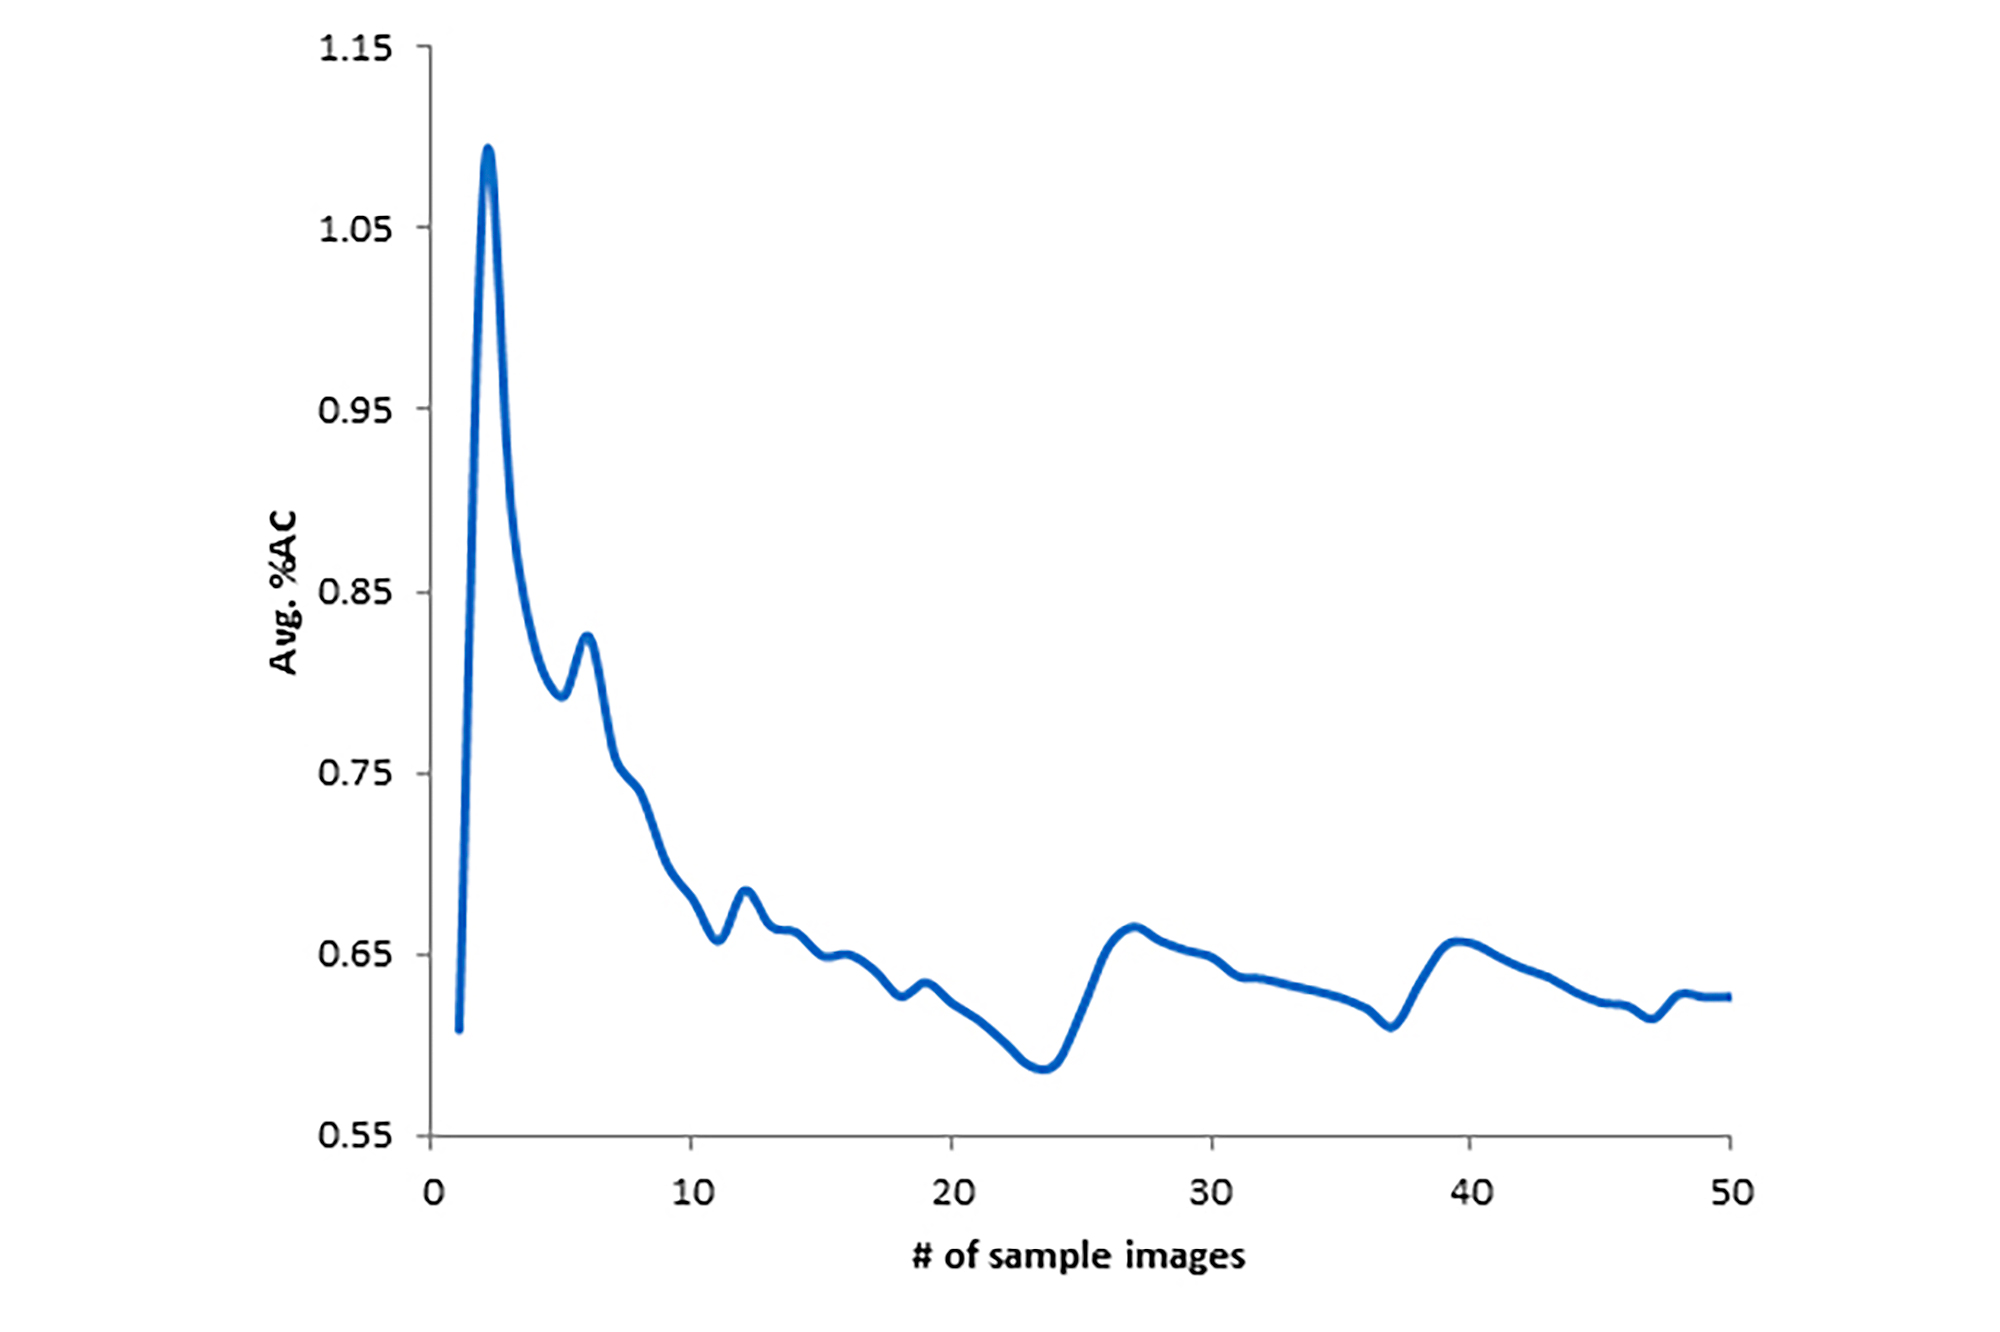
Directional sample sheets were delineated into sixteen columns corresponding to 22.5° each. %AC was calculated for each column and plotted on a rosette diagram (Fig. 9). %AC was calculated for accumulation samples and compared to the ambient dust collection samples from the flood plain.
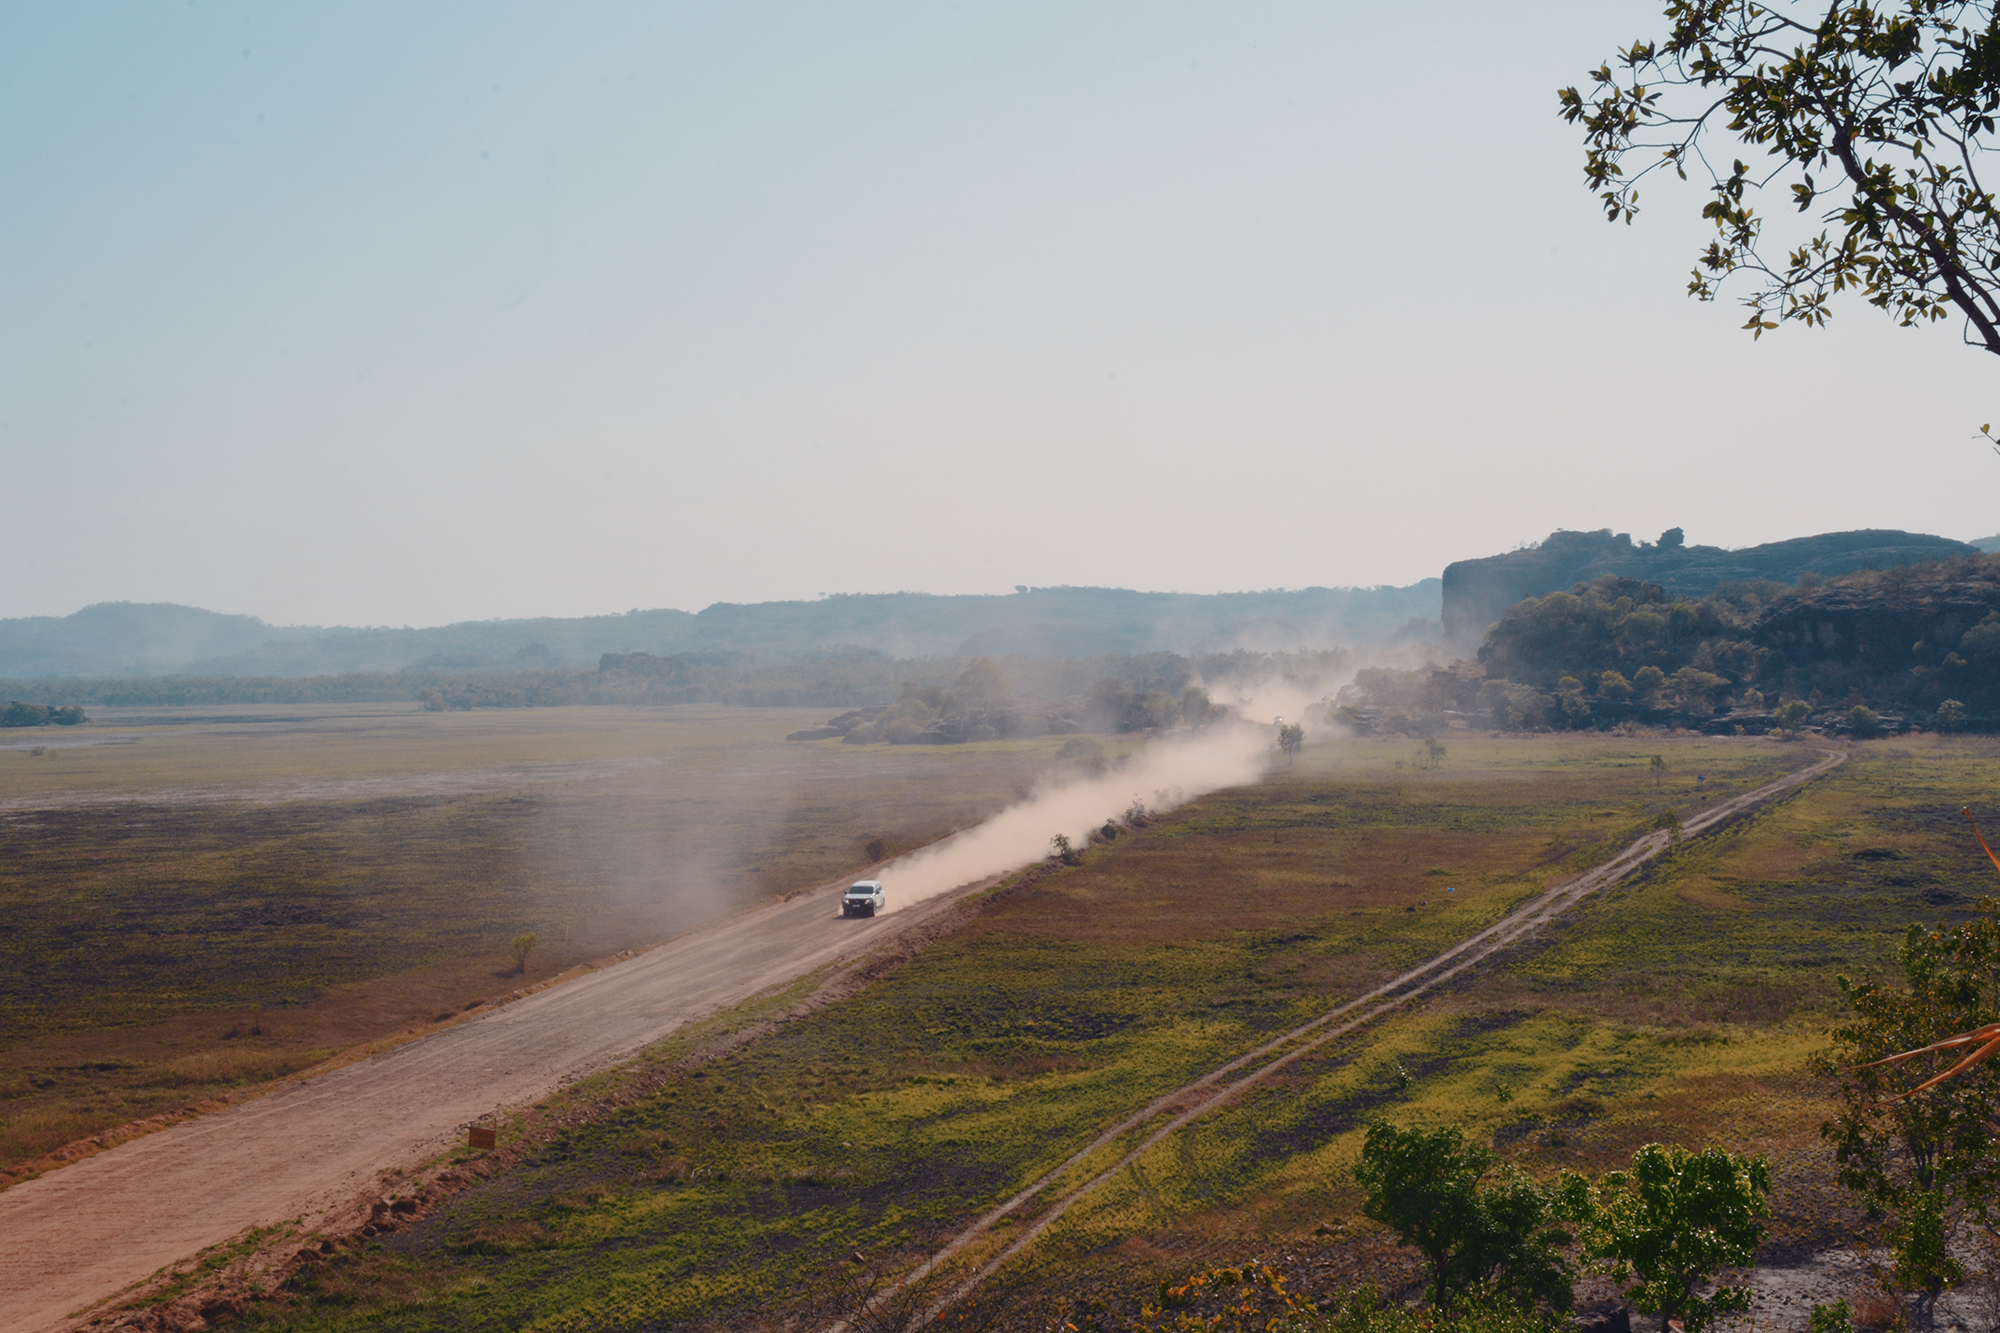
The results demonstrate two clear conclusions. First, the directional samples consistently showed concentrations of dust in the direction of the road accounting for prevailing wind direction (measured by a directional sample placed in the floodplain), pointing to the road as the principal source of local mobilized dust. Second, when compared to the ambient collection samples placed in the floodplain, the accumulation samples all had measurably elevated amounts of dust, indicating that the dust mobilized by traffic on the road was traveling at least 250 meters (the greatest distance of a sample from the road), and rising 20 meters high (the elevation of a sample at one of the rock art sites).
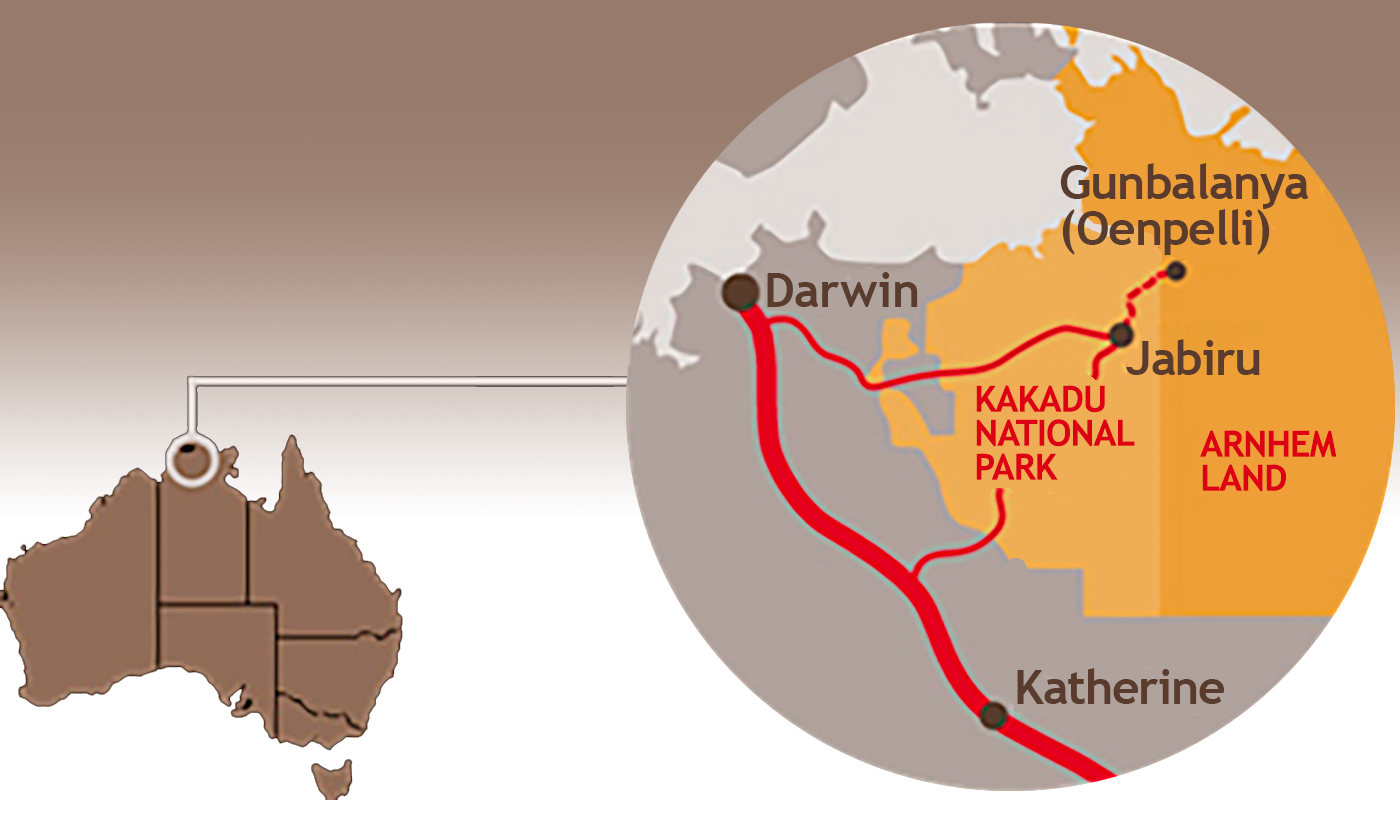
Anecdotally, all these conclusions had been clearly articulated by Njanjma Rangers and other community members of Gunbalanya for years. With this simple study however, they had an evidence-based report that could be presented to officials and decision makers. By 2018, after consultations with the Northern Territory government and the Central Land Council, a decision was adopted to seal a 3km stretch of the road corresponding to the study area.
All photographs and diagrams © Tom McClintock
→ Members and affiliated institutions of the Rock Art Network
by
George Nash
5/09/2024 Recent Articles
→ Sigubudu: Paintings of people with guns in the northern uKhahlamba-Drakensberg
by Aron Mazel
22/07/2024
by Richard Kuba
13/06/2024
by Meenakshi Dubey-Pathak
8/03/2024
by Rock Art Network
6/02/2024
by Rock Art Network
14/12/2023
by Sam Challis
5/12/2023
by Aron Mazel
30/11/2023
by Sam Challis
21/11/2023
by Sam Challis
15/11/2023
by Sam Challis
10/11/2023
by Rock Art Network
6/11/2023
by Rock Art Network
3/11/2023
by Aron Mazel
2/11/2023
by Meenakshi Dubey-Pathak
26/09/2023
by Paul Taçon
24/08/2023
by Aron Mazel
13/06/2023
by Paul Taçon
5/06/2023
by Paul Taçon
15/03/2023
by George Nash
14/03/2023
by Noel Hidalgo Tan
10/02/2023
by George Nash
01/02/2023
by Meenakshi Dubey-Pathak, Pilar Fatás Monforte
29/11/2022
by Aron Mazel, George Nash
21/09/2022
by Paul S.C. Taçon, Sally K. May, Ursula K. Frederick, Jo McDonald
07/07/2022
by Meenakshi Dubey-Pathak
26/07/2022
by Paul Taçon
20/07/2022
by David Coulson
16 June 2022
by Paul Taçon
25 April 2022
by Noel Hidalgo Tan
20 April 2022
by Meenakshi Dubey-Pathak
14 March 2022
by Carolyn Boyd & Pilar Fatás
02 March 2022
by David Coulson
07 February 2022
by Johannes H. N. Loubser
06 February 2022
by Meenakshi Dubey-Pathak
05 February 2022
by Aron Mazel
28 January 2022
by Aron Mazel
8 September 2021
by David Coulson
17 August 2021
by Ffion Reynolds
21 June 2021

by Aron Mazel
22/07/2024
by Richard Kuba
13/06/2024
by Meenakshi Dubey-Pathak
8/03/2024
by Rock Art Network
6/02/2024
by Rock Art Network
14/12/2023
by Sam Challis
5/12/2023
by Aron Mazel
30/11/2023
by Sam Challis
21/11/2023
by Sam Challis
15/11/2023
by Sam Challis
10/11/2023
by Rock Art Network
6/11/2023
by Rock Art Network
3/11/2023
by Aron Mazel
2/11/2023
by Meenakshi Dubey-Pathak
26/09/2023
by Paul Taçon
24/08/2023
by Aron Mazel
13/06/2023
by Paul Taçon
5/06/2023
by Paul Taçon
15/03/2023
by George Nash
14/03/2023
by Noel Hidalgo Tan
10/02/2023
by George Nash
01/02/2023
by Meenakshi Dubey-Pathak, Pilar Fatás Monforte
29/11/2022
by Aron Mazel, George Nash
21/09/2022
by Paul S.C. Taçon, Sally K. May, Ursula K. Frederick, Jo McDonald
07/07/2022
by Meenakshi Dubey-Pathak
26/07/2022
by Paul Taçon
20/07/2022
by David Coulson
16 June 2022
by Paul Taçon
25 April 2022
by Noel Hidalgo Tan
20 April 2022
by Meenakshi Dubey-Pathak
14 March 2022
by Carolyn Boyd & Pilar Fatás
02 March 2022
by David Coulson
07 February 2022
by Johannes H. N. Loubser
06 February 2022
by Meenakshi Dubey-Pathak
05 February 2022
by Aron Mazel
28 January 2022
by Aron Mazel
8 September 2021
by David Coulson
17 August 2021
by Ffion Reynolds
21 June 2021

Friend of the Foundation


by Aron Mazel
22/07/2024
by Richard Kuba
13/06/2024
by Meenakshi Dubey-Pathak
8/03/2024
by Rock Art Network
6/02/2024
by Rock Art Network
14/12/2023
by Sam Challis
5/12/2023
by Aron Mazel
30/11/2023
by Sam Challis
21/11/2023
by Sam Challis
15/11/2023
by Sam Challis
10/11/2023
by Rock Art Network
6/11/2023
by Rock Art Network
3/11/2023
by Aron Mazel
2/11/2023
by Meenakshi Dubey-Pathak
26/09/2023
by Paul Taçon
24/08/2023
by Aron Mazel
13/06/2023
by Paul Taçon
5/06/2023
by Paul Taçon
15/03/2023
by George Nash
14/03/2023
by Noel Hidalgo Tan
10/02/2023
by George Nash
01/02/2023
by Meenakshi Dubey-Pathak, Pilar Fatás Monforte
29/11/2022
by Aron Mazel, George Nash
21/09/2022
by Paul S.C. Taçon, Sally K. May, Ursula K. Frederick, Jo McDonald
07/07/2022
by Meenakshi Dubey-Pathak
26/07/2022
by Paul Taçon
20/07/2022
by David Coulson
16 June 2022
by Paul Taçon
25 April 2022
by Noel Hidalgo Tan
20 April 2022
by Meenakshi Dubey-Pathak
14 March 2022
by Carolyn Boyd & Pilar Fatás
02 March 2022
by David Coulson
07 February 2022
by Johannes H. N. Loubser
06 February 2022
by Meenakshi Dubey-Pathak
05 February 2022
by Aron Mazel
28 January 2022
by Aron Mazel
8 September 2021
by David Coulson
17 August 2021
by Ffion Reynolds
21 June 2021

Friend of the Foundation